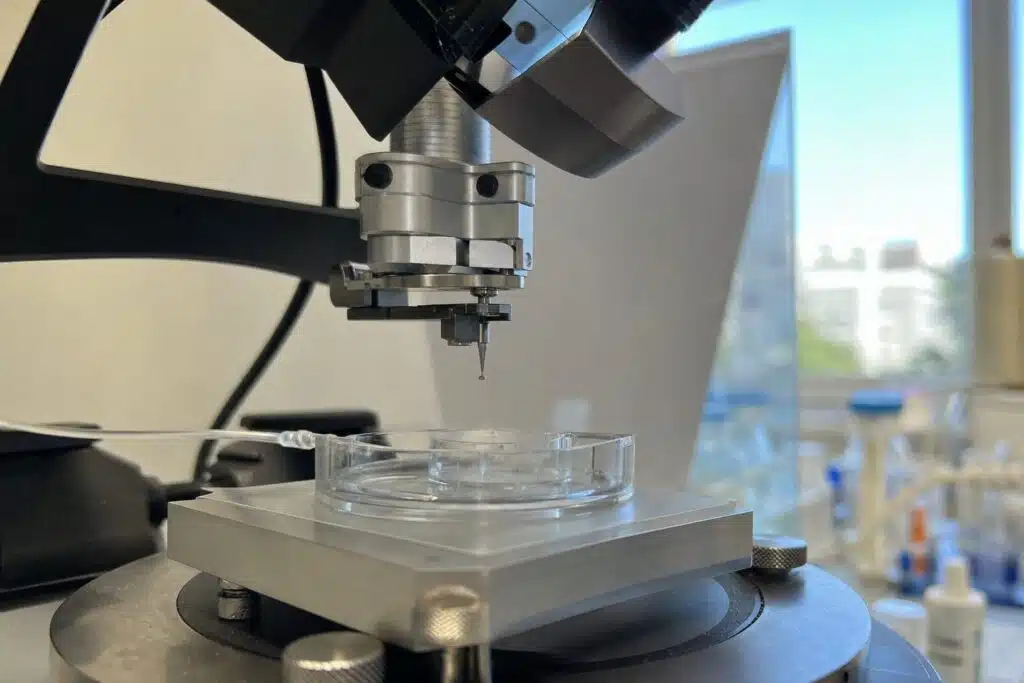
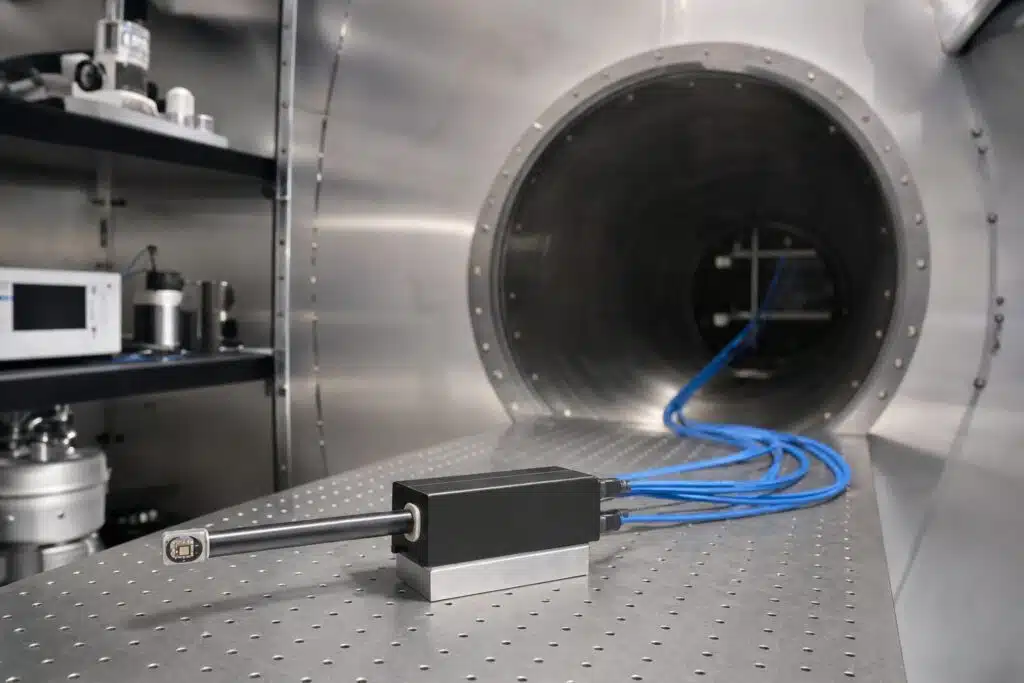
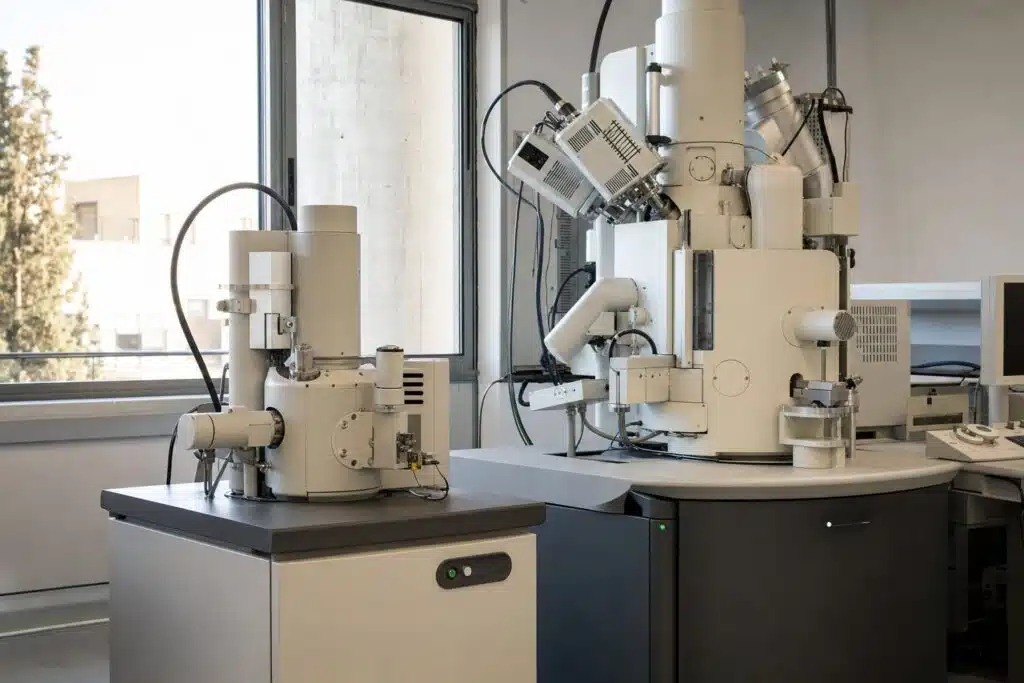
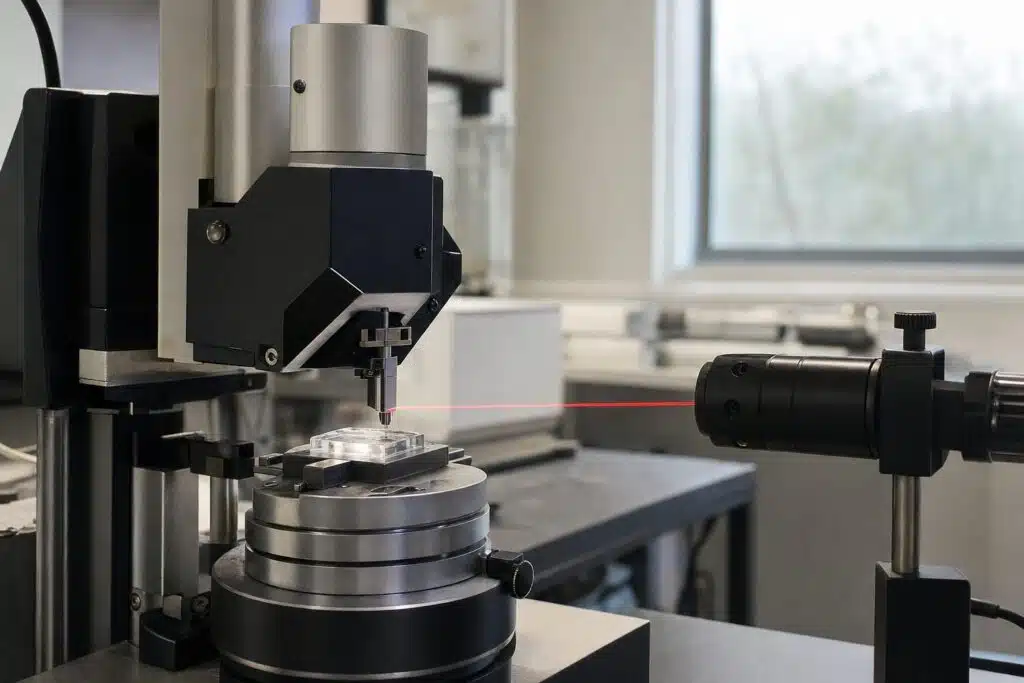
AFM force spectroscopy presses the tip of an atomic force microscope into a surface and pulls it back at one spot, recording force against distance to reveal stiffness, adhesion and binding forces. Imaging tells you what a surface looks like. A force curve tells you how it behaves when you touch it. Repeating the measurement on a grid gives force maps, so mechanical properties can be shown as images beside topography. This guide explains how a force curve is recorded, how to read each part, how stiffness and adhesion are extracted, and where the method is used. If you are new to the instrument, start with how an AFM works.
Table of Contents
How Is a Force Curve Recorded?
The scanner moves the sample, or the tip, vertically while the photodiode records the cantilever deflection. The raw signal is deflection against scanner position. Converting deflection to force uses Hooke’s law: force equals the cantilever spring constant times its deflection. Subtracting the cantilever bend from the scanner movement gives the true tip-sample separation.
The two directions
During approach the tip is far away, then touches and presses into the surface. During retraction the tip releases, and any adhesion pulls the cantilever downward before it snaps free. The two curves are rarely identical, and the difference carries information.
How Do You Read the Parts of a Curve?
| Region | What happens | What it tells you |
|---|---|---|
| Baseline | Tip far from the surface, no force | Zero force reference and noise level |
| Jump to contact | Attractive forces pull the tip in | Surface forces and cantilever stiffness |
| Contact region | Tip indents the sample | Slope gives stiffness, fit gives modulus |
| Retraction and adhesion | Tip pulls off the surface | Adhesion force and work of adhesion |
| Pull-off events | Stretching and rupture of molecules | Unbinding forces and extension length |
The steeper the contact slope on a given cantilever, the stiffer the sample. A hard surface such as glass gives a slope close to the cantilever sensitivity, while a soft hydrogel or cell gives a gentle slope.
How Do You Get Young’s Modulus?
The contact part of the curve is fitted with a contact mechanics model. The Hertz model, or its variants such as Sneddon for a cone and DMT or JKR when adhesion matters, relates indentation depth to force and elastic modulus. The result depends on the tip geometry, so a sphere is common for cells and a sharp tip for hard materials. The Wikipedia article on atomic force microscopy outlines force spectroscopy, and the Hertzian contact article explains the fitting models.
Calibration is essential
Spring constant and deflection sensitivity must be calibrated, because every force value depends on them. The deflection sensitivity comes from the slope of a curve on a hard surface. The spring constant can be found with the thermal tune method or from the cantilever dimensions. Our AFM cantilever guide explains how to choose a lever with a spring constant that matches the sample.
Where Is Force Spectroscopy Used?
- Cells and tissue. Stiffness maps distinguish healthy and diseased cells and track how cells respond to drugs.
- Polymers and coatings. Local modulus and adhesion reveal phases, cross-linking and aging.
- Single-molecule studies. A tip functionalized with a ligand measures the force needed to break a bond, giving unbinding forces. This complements ensemble methods such as SPR versus ITC.
- Colloidal forces. A particle glued to the cantilever measures interaction forces between surfaces in liquid.
- Battery and thin-film materials. Mechanical properties of electrode coatings are linked with performance.
Which AFM Features Help?
Force work needs a low-noise deflection signal, a closed-loop scanner for accurate Z positioning, liquid capability and software for force mapping. Nanosurf lists static force, dynamic force and spectroscopy among the standard modes of the CoreAFM, and its SmartSPM is described by the manufacturer as having closed-loop sensors with low noise and fast scanners. See also the AFM technology page. If you are budgeting for such a system, the atomic force microscope price guide lists what drives the cost.
What Are Common Mistakes?
- Using an uncalibrated cantilever. Force values then carry large, hidden errors.
- Indenting too deep. Fitting models assume small indentation relative to sample thickness, and a stiff substrate below a thin film inflates the modulus.
- Ignoring tip shape. A worn or unknown tip radius changes the fitted modulus.
- Speed effects. Soft materials are viscoelastic, so the measured stiffness depends on the loading rate.
- Too few curves. Collect many curves at many positions and report statistics, not a single result.
Force maps
In force volume or quantitative imaging modes, a curve is taken at every pixel. Each curve is fitted automatically, and the output is a set of maps, such as height, modulus and adhesion, that line up pixel for pixel. This is the fastest way to link structure to mechanical behavior, and it works in air or liquid. Plan for longer acquisition times, because each pixel needs a full approach and retract cycle.
How Should Results Be Interpreted?
Treat modulus values as apparent unless the model assumptions hold: a homogeneous, isotropic, flat sample and small indentation. Cells, for instance, have a stiff cortex over a softer interior, so the number changes with depth. Compare samples measured with the same tip, speed and indentation depth, and include a reference sample such as a polymer of known modulus in each session. Report the median and spread, since modulus distributions are often skewed.
How Do You Start a First Experiment?
Pick a cantilever with a spring constant in the same range as the sample stiffness. Calibrate its sensitivity on a hard surface and its spring constant by thermal tuning. Engage on the sample, set a modest force limit, and record a few curves at one spot to check they repeat. Then collect curves on a grid, fit the contact region, and report the model, tip radius and indentation depth together with the modulus.
Interested in AFM force spectroscopy for cells, polymers or thin films?
Frequently Asked Questions
What is AFM force spectroscopy?
It records force against tip-sample distance at a single point, giving stiffness, adhesion and binding forces instead of an image.
How is force calculated in AFM?
Force equals the cantilever spring constant times its deflection, according to Hooke’s law, so both spring constant and sensitivity must be calibrated.
What is a force map?
A force map takes a force curve at every pixel of a grid and fits each one, producing images of modulus, adhesion and other properties.
Which model gives Young’s modulus?
The Hertz model and its variants, such as Sneddon, DMT and JKR, fit the contact region and relate indentation to elastic modulus.
Can AFM force spectroscopy be done in liquid?
Yes, and it is common for cells, biomolecules and hydrogels, which need a liquid environment to behave naturally.
What causes adhesion in a retraction curve?
Capillary, van der Waals, electrostatic and chemical bonding forces hold the tip to the surface and show as a dip below the baseline.
Last updated: November 2026