A Raman microscope couples a laser, an optical microscope and a spectrometer, so you can identify the chemical makeup of a spot only a micrometre or so across by reading how its molecules scatter light. Most scattered light keeps the laser wavelength, but a tiny fraction shifts by amounts that match the molecule vibrations, and that shift pattern is a chemical fingerprint. This guide explains how the instrument is built, what samples and questions suit it, which options matter when buying, and how it relates to related methods. For the technique on its own, see our Raman spectroscopy overview.
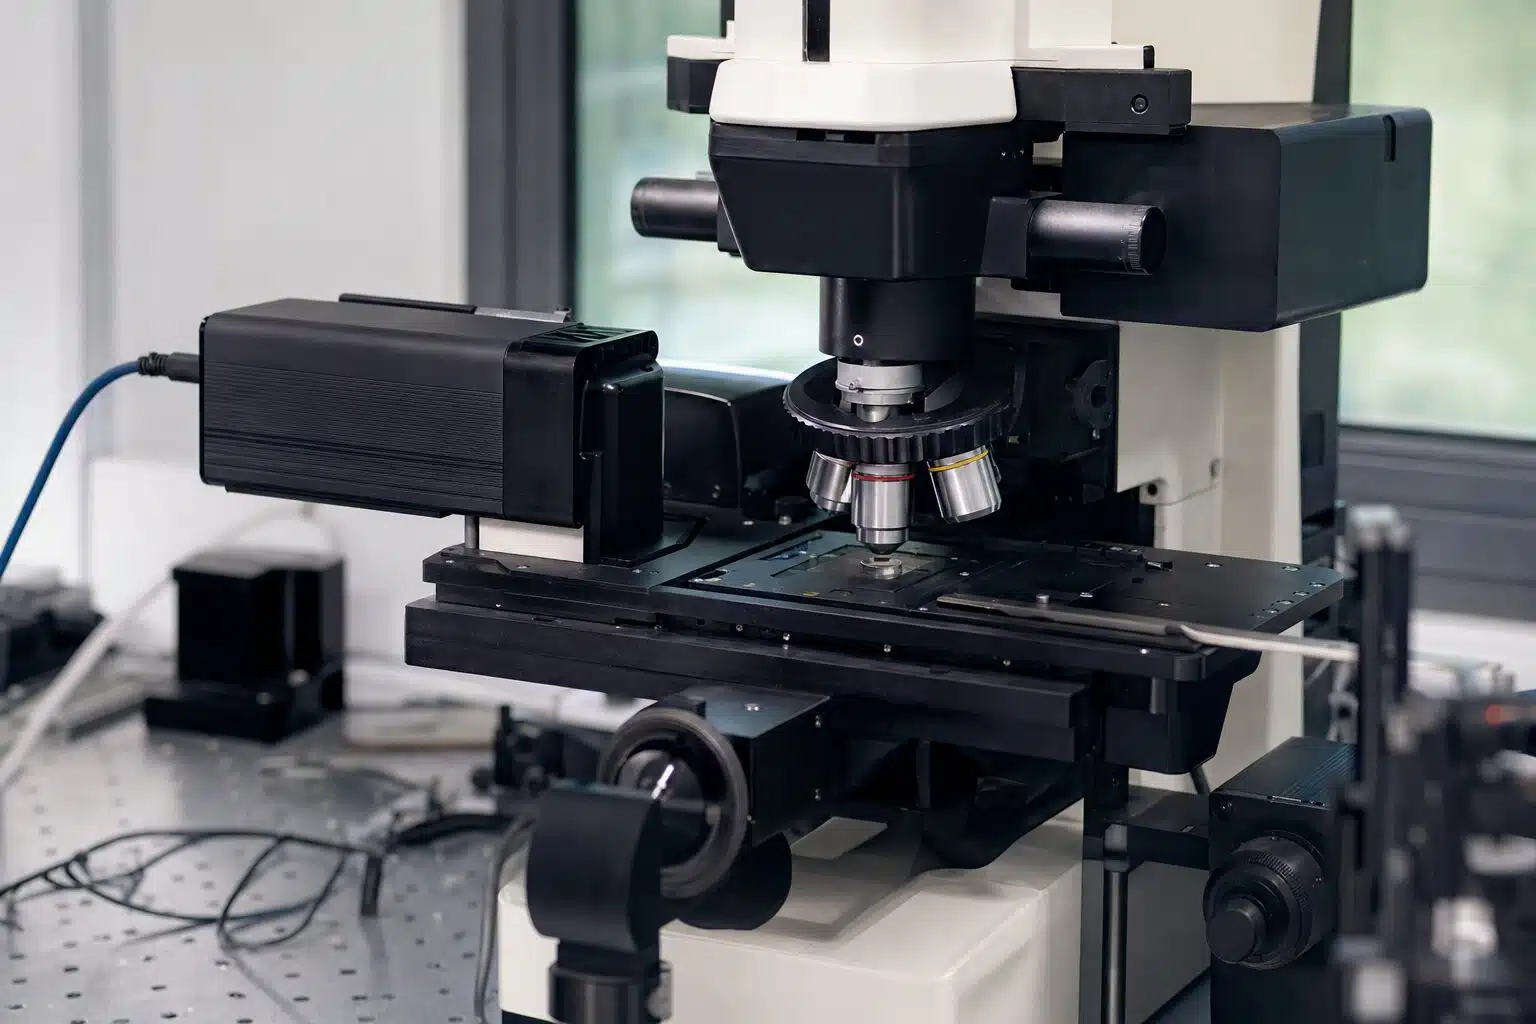
Table of Contents
- What Does a Raman Microscope Measure?
- What Is Inside the Instrument?
- Why Does Confocality Matter?
- What Can You Analyze?
- Can Raman Go Below the Diffraction Limit?
- How Does It Differ From Other Methods?
- What Are the Limitations of Raman Microscopy?
- What Should You Check Before Buying?
- How Do You Get Better Spectra?
- Frequently Asked Questions
What Does a Raman Microscope Measure?
When a monochromatic laser hits a sample, most photons scatter elastically at the same wavelength, which is called Rayleigh scattering. About one in a million scatters inelastically, losing or gaining energy to molecular vibrations. This is Raman scattering, described in the Raman spectroscopy article on Wikipedia. The spectrum plots intensity against the Raman shift in wavenumbers, and each peak corresponds to a vibration of a bond or lattice.
Why add a microscope
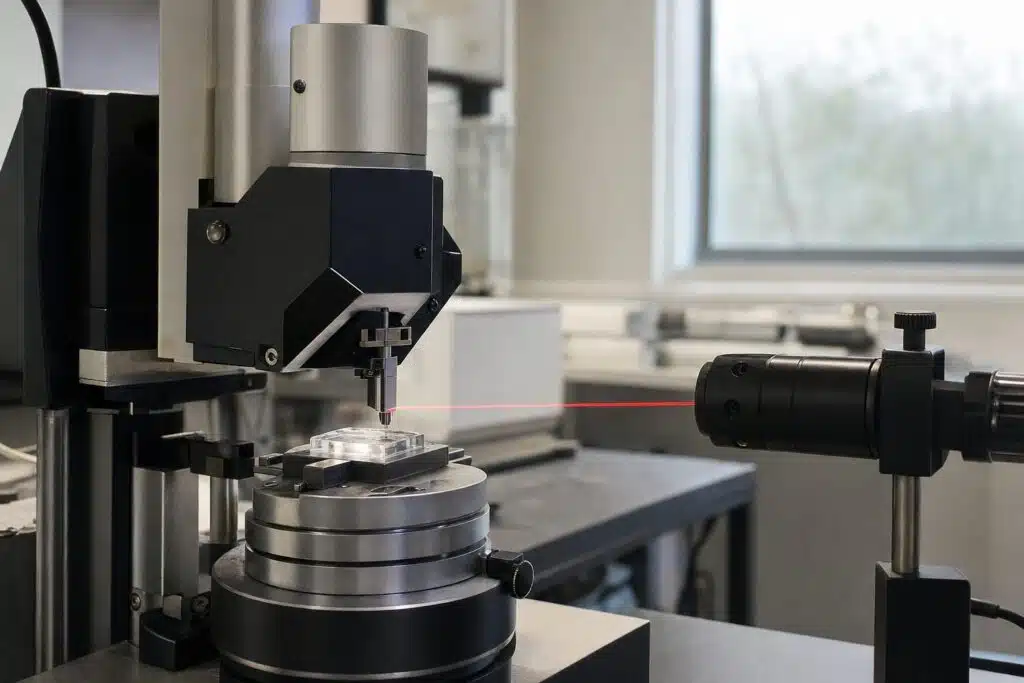
Focusing the laser through a microscope objective gives a small spot, so you can analyze a single particle, a layer in a cross section or a defect, and map how composition changes across a surface. The optical image shows exactly where the spectrum was taken.
What Is Inside the Instrument?
- Laser. Common choices include visible and near infrared lasers. Shorter wavelengths scatter more strongly but can excite fluorescence in some samples.
- Microscope and objectives. They focus the beam and collect the scattered light.
- Filters. A notch or edge filter blocks the strong Rayleigh light and passes the weak Raman signal.
- Spectrometer and grating. It disperses the signal. Several gratings trade spectral resolution against range.
- Detector. A sensitive CCD records the spectrum.
- Motorized stage. It allows mapping, where a spectrum is collected at each point.
Why Does Confocality Matter?
A confocal pinhole rejects light from above and below the focal plane. That sharpens depth resolution and cuts background, so you can probe a thin film under a coating or one layer of a polymer laminate. We cover the optics in confocal Raman microscopy.
What Can You Analyze?
| Field | Typical question | What Raman shows |
|---|---|---|
| Polymers and plastics | Which polymer is this, and is it crystalline? | Characteristic peaks and peak widths |
| Pharmaceuticals | Which crystal form is the drug in? | Polymorph differences |
| Carbon materials | How ordered is this graphene or nanotube? | D and G band positions and ratios |
| Semiconductors | What is the strain or composition? | Peak shift and width |
| Geology and art | What mineral or pigment is this? | Fingerprint match to a library |
Samples need little preparation, and water gives a weak Raman signal, so aqueous samples are practical. Fluorescent samples are the main difficulty, and choosing a longer laser wavelength often helps.
Can Raman Go Below the Diffraction Limit?
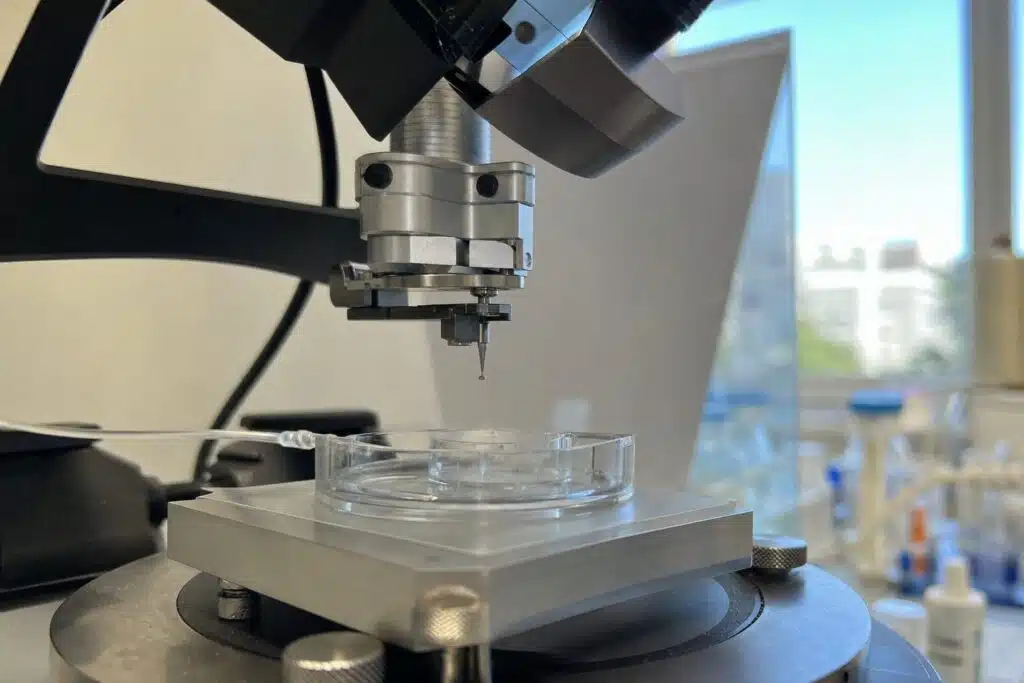
Yes, with tip-enhanced Raman spectroscopy (TERS), where a sharp metallic probe from a scanning probe microscope enhances the signal at the tip apex. Horiba presents the XploRA Nano and LabRAM Soleil Nano as combined AFM-Raman platforms, where macro, micro and nano scale measurements run on one system. The manufacturer lists SPM modes such as AFM, force curves, conductive and Kelvin probe modes, STM, liquid cells and electrochemical environments, with chemical mapping by TERS or tip-enhanced photoluminescence. Our article on tip-enhanced Raman spectroscopy explains the method in depth.
How Does It Differ From Other Methods?
Raman and infrared both probe molecular vibrations, but they follow different selection rules, so they often complement each other. We compare them in Raman vs. FTIR spectroscopy. For field screening, a handheld Raman spectrometer trades spatial resolution for portability.
What Are the Limitations of Raman Microscopy?
Raman scattering is weak, so signals from dilute or thin samples can need long acquisition times. Fluorescence can swamp the spectrum, and strongly absorbing or dark samples may heat under the laser. Metals give no first-order Raman signal, although their surface oxides do. Quantitative work needs calibration standards, because intensity depends on laser power, focus and sample surface.
Ways to work around them
Switching to a near infrared laser reduces fluorescence. Lower power, a larger spot or a rotating sample spreads the heat. Surface-enhanced Raman spectroscopy uses nanostructured metal surfaces to boost weak signals from trace analytes. Photoluminescence mapping, available on many of the same platforms, complements Raman in semiconductor and 2D material studies.
When another tool is better
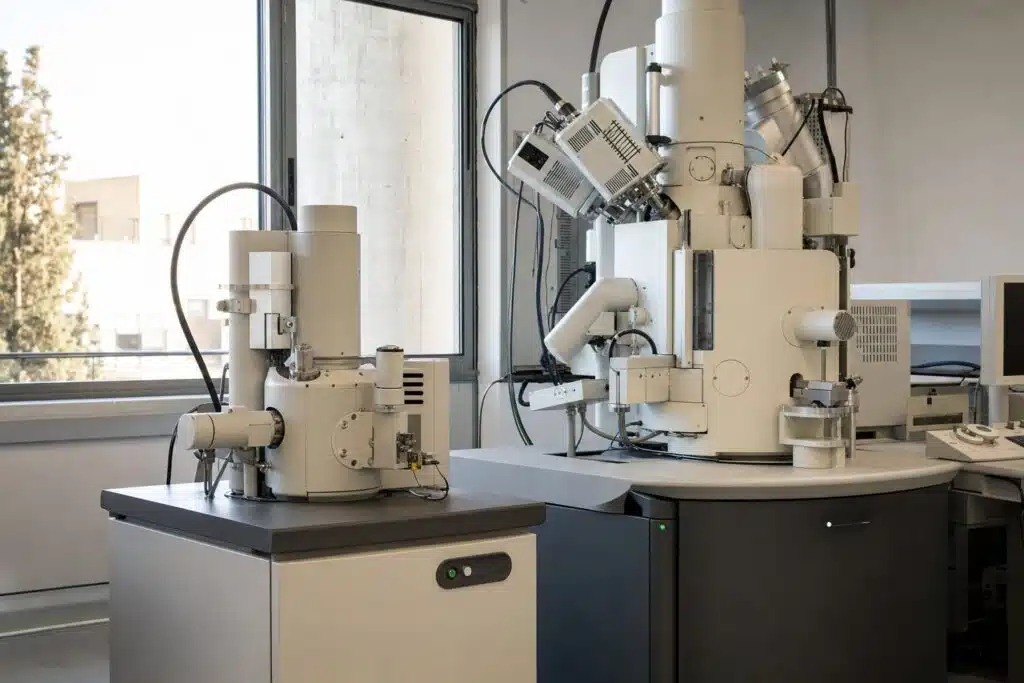
For elemental analysis you want an electron microscope with an X-ray detector, covered in our FIB-SEM guide. For topography at the nanometre scale, atomic force microscopy is the right tool, and the combined systems above let you use both on one spot.
What Should You Check Before Buying?
- Laser options. More than one wavelength gives flexibility for fluorescent samples.
- Spectral resolution and range. Multiple gratings with automatic switching help.
- Spatial resolution and mapping speed. Check the stage and the software for imaging.
- Automation. Auto-alignment and calibration reduce user dependence.
- Expansion. Options such as an AFM, photoluminescence or a liquid cell protect your investment.
- Sample environments. Temperature stages and electrochemical cells extend what you can study.
How Do You Get Better Spectra?
Start at low laser power and raise it carefully, since many samples absorb light and heat locally, which can damage them or shift peaks. Use the shortest integration time that gives a clear signal, and average several scans to reduce noise. Calibrate the spectrometer with a known standard such as silicon, whose strong peak near 520 wavenumbers is widely used. For maps, choose a step size that matches the spot size, and subtract a baseline to remove fluorescence background before comparing peaks.
Reading the result
Compare peak positions with a reference library, then check the relative intensities and widths. Narrow peaks indicate ordered crystalline material, while broad peaks usually indicate disorder or amorphous content. Always confirm an identification with a second method when the decision matters.
Looking for a Raman microscope that fits your samples and budget?
Frequently Asked Questions
What is a Raman microscope used for?
It identifies materials and maps chemical composition at micrometre scale, for example in polymers, pharmaceuticals, carbon materials, semiconductors and minerals.
How is Raman different from FTIR?
Both measure molecular vibrations, but Raman detects scattered light and works well with water and glass, while FTIR measures absorption and is strong for polar bonds.
Does Raman need sample preparation?
Usually very little. Many samples can be measured as they are, through glass or plastic, although fluorescent samples may need a different laser.
What is confocal Raman?
A pinhole rejects out of focus light, giving depth resolution so individual layers or inclusions can be analyzed.
What is TERS?
Tip-enhanced Raman spectroscopy uses a sharp metal tip to enhance the signal, giving chemical information below the optical diffraction limit.
Can a Raman microscope damage the sample?
High laser power can heat and burn sensitive samples, so work at low power first and raise it only if the sample tolerates it.
Last updated: November 2026